Building on the last post where I created a custom Vehicle filed, I wanted to do a little more with it. Why not make a Dashboard to display the information I was collecting?
I started by adding data to the Vehicle field across the dummy accounts on my dev org.
All dashboards are visual representations of reports, so I needed to build one of those first. Going to the Reports tab I clicked on New Report. Then I expanded the Accounts & Contacts folder and selected the Accounts line. I then clicked on the Create button.
On this screen I adjusted the filters to display all of the accounts. Now I can drag the "Vehicle" line from the left column to the report. Once that's done I changed the format from Tabular to Summary so I can work with it later in a dashboard.
Here you will see a highlighted line at the top that says "Drop a field here to create a grouping." I need to group the Vehicle field in order to report on it so I dragged it there. Now the Report gets saved.
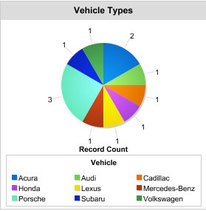
Going back to the Reports tab I clicked New Dashboard. I Dragged the pie chart over to the view then went to find my report by changing to the left column tab to Data Sources. I pulled the Report over to the pie chart that was just created. Added in some header / footer text and saved the dashboard.
Now from the home page when you click on the Dahsboards tab you can look at the new creation. Pretty spiffy huh? If I had more data I am sure I could think of something much more creative to do with Reports & Dashboards but this gives you a good idea of how it works.
I started by adding data to the Vehicle field across the dummy accounts on my dev org.
All dashboards are visual representations of reports, so I needed to build one of those first. Going to the Reports tab I clicked on New Report. Then I expanded the Accounts & Contacts folder and selected the Accounts line. I then clicked on the Create button.
On this screen I adjusted the filters to display all of the accounts. Now I can drag the "Vehicle" line from the left column to the report. Once that's done I changed the format from Tabular to Summary so I can work with it later in a dashboard.
Here you will see a highlighted line at the top that says "Drop a field here to create a grouping." I need to group the Vehicle field in order to report on it so I dragged it there. Now the Report gets saved.
Going back to the Reports tab I clicked New Dashboard. I Dragged the pie chart over to the view then went to find my report by changing to the left column tab to Data Sources. I pulled the Report over to the pie chart that was just created. Added in some header / footer text and saved the dashboard.
Now from the home page when you click on the Dahsboards tab you can look at the new creation. Pretty spiffy huh? If I had more data I am sure I could think of something much more creative to do with Reports & Dashboards but this gives you a good idea of how it works.
 RSS Feed