I really enjoy analyzing data… could be why I am a self proclaimed dork in the data arena!
It is particularly great when you get to work with a client who appreciates the same thing. It perplexes me that people focus so much on getting information into their crm systems but don’t know how to really dive into it.
Reporting and dashboards can really make magic happen. Typically people know enough about reporting to be dangerous and stop when they hit a road block.
While working with someone today we discovered that they were headed in the right direction with their reports but couldn’t get the dashboard components just right. This alone caused them to temporarily abandon sharing their successes with their teams.
All we had to do was add some of the new dashboard filters (which I love by the way) and rework the charts on some source reports and voila.
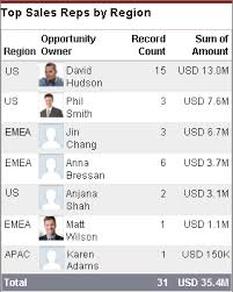
Many users seem to forget how to add more than two columns to their table dashboard components. For an example scenario and walk through on this please follow the link below: http://success.salesforce.com/questionDetail?qId=08730000000IvhFAAS
~J
It is particularly great when you get to work with a client who appreciates the same thing. It perplexes me that people focus so much on getting information into their crm systems but don’t know how to really dive into it.
Reporting and dashboards can really make magic happen. Typically people know enough about reporting to be dangerous and stop when they hit a road block.
While working with someone today we discovered that they were headed in the right direction with their reports but couldn’t get the dashboard components just right. This alone caused them to temporarily abandon sharing their successes with their teams.
All we had to do was add some of the new dashboard filters (which I love by the way) and rework the charts on some source reports and voila.
Many users seem to forget how to add more than two columns to their table dashboard components. For an example scenario and walk through on this please follow the link below: http://success.salesforce.com/questionDetail?qId=08730000000IvhFAAS
~J
 RSS Feed